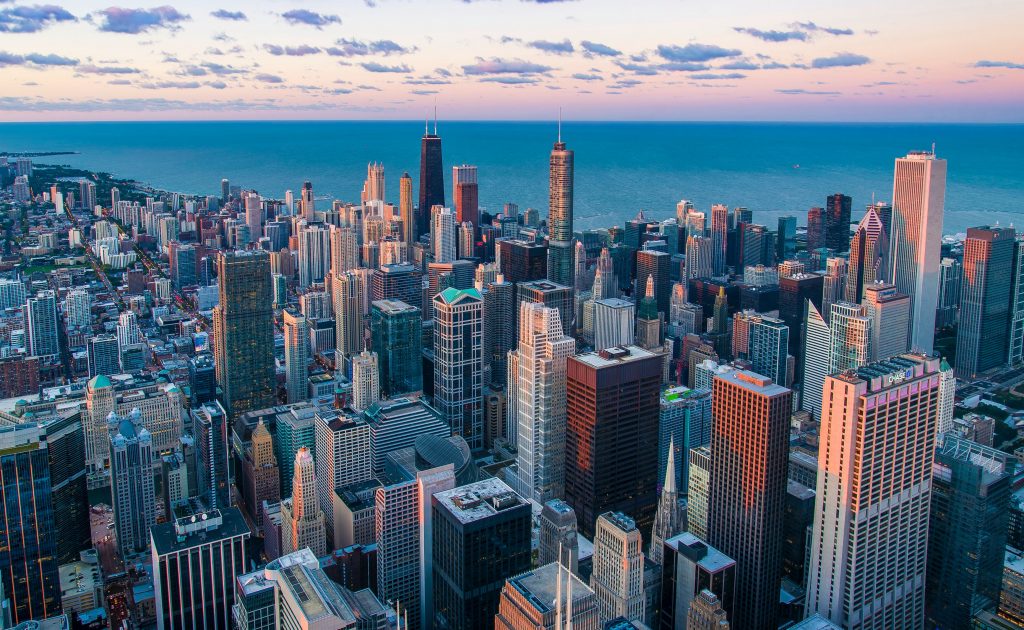
This 3D map shows the U.S. cities with the highest economic output.
- The United States has the world’s largest economy at more than $21 trillion dollars.
- A new report has shown the nation’s top 10 cities, by economic outlook.
- The number 1 spot is taken up by New York City, totalling $1.77 trillion in 2018.
At over $21 trillion, the U.S. holds the title of the world’s largest economy—accounting for almost a quarter of the global GDP total. However, the fact is that a few select cities are responsible for a large share of the country’s total economic output.
This unique 3D map from HowMuch puts into perspective the city corridors which contribute the most to the American economy at large.
Top 10 Metros by Economic Output
The visualization pulls the latest data from the U.S. Bureau of Economic Analysis (BEA, 2018), and ranks the top 10 metro area economies in the country.
One thing is immediately clear—the New York metro area dwarfs all other metro area by a large margin. This cluster, which includes Newark and Jersey City, is bigger than the metro areas surrounding Los Angeles and Chicago combined.
Coming in fourth place is San Francisco on the West Coast, with $549 billion in total economic output each year. Meanwhile in the South, the Dallas metroplex brings in $478 billion, placing it sixth in the ranks.
It’s worth noting that using individual metro areas is one way to view things, but geographers also think of urban life in broader terms as well. Given the proximity of cities in the Northeast, places like Boston, NYC, and Washington, D.C. are sometimes grouped into a single megaregion. When viewed this way, the corridor is actually the world’s largest in economic terms.
U.S. States: Sum of Its Parts
Zooming out beyond just these massive cities demonstrates the combined might of the U.S. in another unique way. Tallying all the urban and rural areas, every state economy can be compared to the size of entire countries.


